Note
Go to the end to download the full example code
SortingAnalyzer
SpikeInterface provides an object to gather a Recording and a Sorting to perform various
analyses and visualizations of the sorting : SortingAnalyzer.
This SortingAnalyzer class:
is the first step for all post post processing, quality metrics, and visualization.
gathers a recording and a sorting
can be sparse or dense : (i.e. whether all channel are used for all units or not).
handle a list of “extensions”
“core extensions” are the ones to extract some waveforms to compute templates: * “random_spikes” : select randomly a subset of spikes per unit * “waveforms” : extract waveforms per unit * “templates”: compute templates using average or median * “noise_levels” : compute noise levels from traces (useful to get the snr of units)
can be in memory or persistent to disk (2 formats binary/npy or zarr)
More extensions are available in spikeinterface.postprocessing like “principal_components”, “spike_amplitudes”, “unit_lcations”, …
Here is the how!
import matplotlib.pyplot as plt

from spikeinterface import download_dataset
from spikeinterface import create_sorting_analyzer, load_sorting_analyzer
import spikeinterface.extractors as se
First let’s use the repo https://gin.g-node.org/NeuralEnsemble/ephy_testing_data to download a MEArec dataset. It is a simulated dataset that contains “ground truth” sorting information:
repo = "https://gin.g-node.org/NeuralEnsemble/ephy_testing_data"
remote_path = "mearec/mearec_test_10s.h5"
local_path = download_dataset(repo=repo, remote_path=remote_path, local_folder=None)
[INFO] Cloning dataset to Dataset(/home/docs/spikeinterface_datasets/ephy_testing_data)
[INFO] Attempting to clone from https://gin.g-node.org/NeuralEnsemble/ephy_testing_data to /home/docs/spikeinterface_datasets/ephy_testing_data
[INFO] Start enumerating objects
[INFO] Start counting objects
[INFO] Start compressing objects
[INFO] Start receiving objects
[INFO] Start resolving deltas
[INFO] Completed clone attempts for Dataset(/home/docs/spikeinterface_datasets/ephy_testing_data)
install(ok): /home/docs/spikeinterface_datasets/ephy_testing_data (dataset)
get(ok): mearec/mearec_test_10s.h5 (file) [from origin...]
Let’s now instantiate the recording and sorting objects:
recording = se.MEArecRecordingExtractor(local_path)
print(recording)
sorting = se.MEArecSortingExtractor(local_path)
print(sorting)
MEArecRecordingExtractor: 32 channels - 32.0kHz - 1 segments - 320,000 samples - 10.00s
                          float32 dtype - 39.06 MiB
  file_path: /home/docs/spikeinterface_datasets/ephy_testing_data/mearec/mearec_test_10s.h5
MEArecSortingExtractor: 10 units - 1 segments - 32.0kHz
  file_path: /home/docs/spikeinterface_datasets/ephy_testing_data/mearec/mearec_test_10s.h5
The MEArec dataset already contains a probe object that you can retrieve and plot:
probe = recording.get_probe()
print(probe)
from probeinterface.plotting import plot_probe

plot_probe(probe)
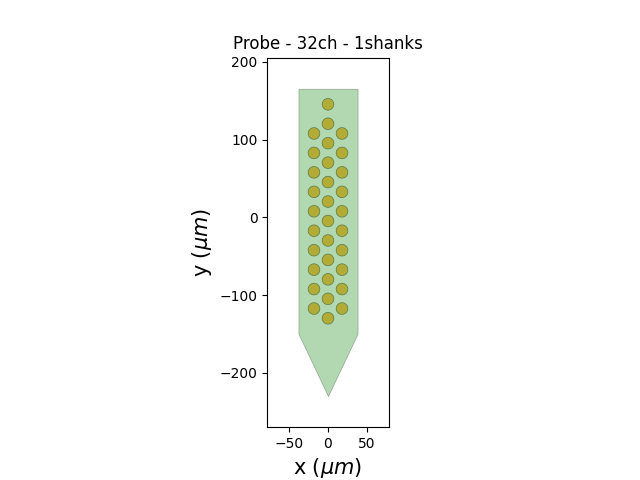
Probe - 32ch - 1shanks

(<matplotlib.collections.PolyCollection object at 0x7f9b787e5300>, <matplotlib.collections.PolyCollection object at 0x7f9b78ada860>)
A SortingAnalyzer object can be created with the
create_sorting_analyzer() function (this defaults to a sparse
representation of the waveforms)
Here the format is “memory”.
analyzer = create_sorting_analyzer(sorting=sorting, recording=recording, format="memory")
print(analyzer)
estimate_sparsity:   0%|          | 0/10 [00:00<?, ?it/s]
estimate_sparsity: 100%|##########| 10/10 [00:00<00:00, 698.42it/s]
SortingAnalyzer: 32 channels - 10 units - 1 segments - memory - sparse - has recording
Loaded 0 extensions:
A SortingAnalyzer object can be persistant to disk
when using format=”binary_folder” or format=”zarr”
folder = "analyzer_folder"
analyzer = create_sorting_analyzer(sorting=sorting,
                                   recording=recording,
                                   format="binary_folder",
                                   return_scaled=True, # this is the default to attempt to return scaled
                                   folder=folder
                                   )
print(analyzer)

# then it can be loaded back
analyzer = load_sorting_analyzer(folder)
print(analyzer)
estimate_sparsity:   0%|          | 0/10 [00:00<?, ?it/s]
estimate_sparsity: 100%|##########| 10/10 [00:00<00:00, 735.15it/s]
SortingAnalyzer: 32 channels - 10 units - 1 segments - binary_folder - sparse - has recording
Loaded 0 extensions:
SortingAnalyzer: 32 channels - 10 units - 1 segments - binary_folder - sparse - has recording
Loaded 0 extensions:
No extensions are computed yet. Lets compute the most basic ones : select some random spikes per units, extract waveforms (sparse in this example) and compute templates. You can see that printing the object indicates which extension are already computed.
analyzer.compute(
    "random_spikes",
    method="uniform",
    max_spikes_per_unit=500,
)
analyzer.compute("waveforms", ms_before=1.0, ms_after=2.0)
analyzer.compute("templates", operators=["average", "median", "std"])
print(analyzer)
compute_waveforms:   0%|          | 0/10 [00:00<?, ?it/s]
compute_waveforms: 100%|##########| 10/10 [00:00<00:00, 111.35it/s]
SortingAnalyzer: 32 channels - 10 units - 1 segments - binary_folder - sparse - has recording
Loaded 3 extensions: random_spikes, waveforms, templates
To speed up computation, some steps like “waveforms” can also be extracted using parallel processing (recommended!). Like this
analyzer.compute(
    "waveforms", ms_before=1.0, ms_after=2.0, n_jobs=8, chunk_duration="1s", progress_bar=True
)

# which is equivalent to this:
job_kwargs = dict(n_jobs=8, chunk_duration="1s", progress_bar=True)
analyzer.compute("waveforms", ms_before=1.0, ms_after=2.0, **job_kwargs)
compute_waveforms:   0%|          | 0/10 [00:00<?, ?it/s]
compute_waveforms:  10%|█         | 1/10 [00:00<00:01,  6.93it/s]
compute_waveforms:  20%|██        | 2/10 [00:00<00:01,  7.90it/s]
compute_waveforms: 100%|██████████| 10/10 [00:00<00:00, 33.66it/s]
compute_waveforms: 100%|██████████| 10/10 [00:00<00:00, 26.22it/s]

compute_waveforms:   0%|          | 0/10 [00:00<?, ?it/s]
compute_waveforms:  20%|██        | 2/10 [00:00<00:00, 15.90it/s]
compute_waveforms:  40%|████      | 4/10 [00:00<00:00, 14.73it/s]
compute_waveforms: 100%|██████████| 10/10 [00:00<00:00, 27.92it/s]

<spikeinterface.core.analyzer_extension_core.ComputeWaveforms object at 0x7f9b73c63670>
Because certain extensions rely on others (e.g. we need waveforms to calculate the templates) if we recompute an extension it will delete any children extensions Since we just recalculated “waveforms” when we print our analyzer we will see that it no longer has templates
print(analyzer)

# so let's get our templates back.
analyzer.compute("templates", operators=["average", "median", "std"])
SortingAnalyzer: 32 channels - 10 units - 1 segments - binary_folder - sparse - has recording
Loaded 2 extensions: random_spikes, waveforms

<spikeinterface.core.analyzer_extension_core.ComputeTemplates object at 0x7f9b7605d0c0>
Each extension can retrieve some data For instance the “waveforms” extension can retrieve waveforms per units which is a numpy array of shape (num_spikes, num_sample, num_channel):
ext_wf = analyzer.get_extension("waveforms")
for unit_id in analyzer.unit_ids:
    wfs = ext_wf.get_waveforms_one_unit(unit_id)
    print(unit_id, ":", wfs.shape)
#0 : (53, 96, 24)
#1 : (50, 96, 15)
#2 : (43, 96, 17)
#3 : (30, 96, 20)
#4 : (48, 96, 25)
#5 : (37, 96, 19)
#6 : (51, 96, 20)
#7 : (111, 96, 11)
#8 : (195, 96, 14)
#9 : (129, 96, 23)
Same for the “templates” extension. Here we can get all templates at once with shape (num_units, num_sample, num_channel): For this extension, we can get the template for all units either using the median or the average
ext_templates = analyzer.get_extension("templates")

av_templates = ext_templates.get_data(operator="average")
print(av_templates.shape)

median_templates = ext_templates.get_data(operator="median")
print(median_templates.shape)
(10, 96, 32)
(10, 96, 32)
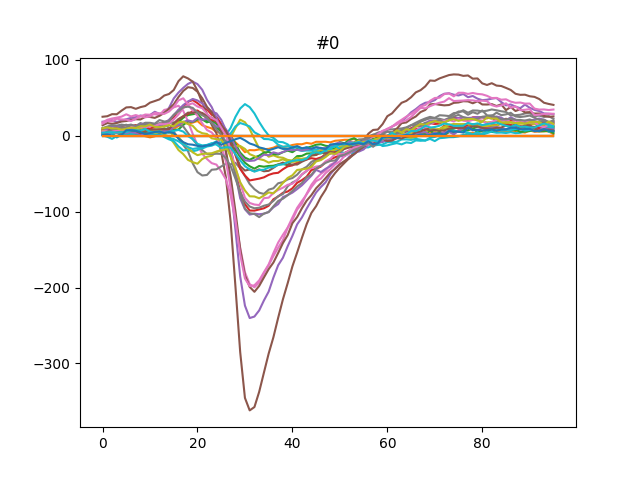
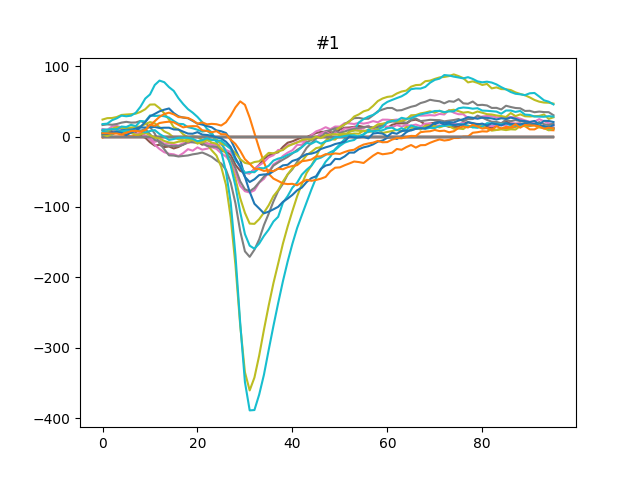
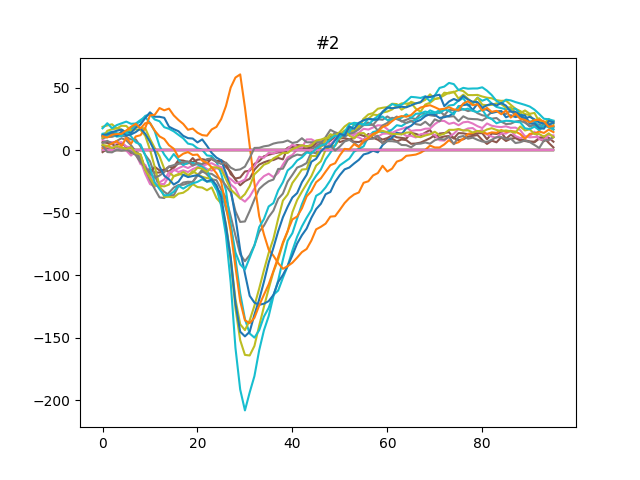
This can be plotted easily.
for unit_index, unit_id in enumerate(analyzer.unit_ids[:3]):
    fig, ax = plt.subplots()
    template = av_templates[unit_index]
    ax.plot(template)
    ax.set_title(f"{unit_id}")
The SortingAnalyzer can be saved to another format using save_as() So the computation can be done with format=”memory” and then saved to disk in the zarr format by using save_as()
analyzer.save_as(folder="analyzer.zarr", format="zarr")
SortingAnalyzer: 32 channels - 10 units - 1 segments - zarr - has recording
Loaded 3 extensions: random_spikes, waveforms, templates
The SortingAnalyzer also offers select_units() method which allows exporting only some relevant units for instance to a new SortingAnalyzer instance.
analyzer_some_units = analyzer.select_units(
    unit_ids=analyzer.unit_ids[:5], format="binary_folder", folder="analyzer_some_units"
)
print(analyzer_some_units)


plt.show()
SortingAnalyzer: 32 channels - 5 units - 1 segments - binary_folder - sparse - has recording
Loaded 3 extensions: random_spikes, waveforms, templates
Total running time of the script: (7 minutes 1.903 seconds)