Note
Go to the end to download the full example code
Recording objects
The BaseRecording is the basic class for handling recorded data.
Here is how it works.
A RecordingExtractor handles:
traces retrieval across segments
dumping to/loading from dict-json
saving (caching)
import matplotlib.pyplot as plt

import numpy as np
import spikeinterface.extractors as se
We will create a RecordingExtractor object from scratch using numpy and the
NumpyRecording.
Let’s define the properties of the dataset:
num_channels = 7
sampling_frequency = 30000.0  # in Hz
durations = [10.0, 15.0]  # in s for 2 segments
num_segments = 2
num_timepoints = [int(sampling_frequency * d) for d in durations]
We can generate a pure-noise timeseries dataset for 2 segments with 2 different durations:
traces0 = np.random.normal(0, 10, (num_timepoints[0], num_channels))
traces1 = np.random.normal(0, 10, (num_timepoints[1], num_channels))
And instantiate a NumpyRecording. Each object has a pretty print to
summarize its content:
recording = se.NumpyRecording(traces_list=[traces0, traces1], sampling_frequency=sampling_frequency)
print(recording)
NumpyRecording: 7 channels - 30.0kHz - 2 segments - 750,000 samples - 25.00s - float64 dtype
                40.05 MiB
Segments:
Samples:   300,000 | 450,000
Durations: 10.00s | 15.00s
Memory:    16.02 MiB | 24.03 MiB
We can now print properties that the RecordingExtractor retrieves from the underlying recording.
print(f"Number of channels = {len(recording.get_channel_ids())}")
print(f"Sampling frequency = {recording.get_sampling_frequency()} Hz")
print(f"Number of segments= {recording.get_num_segments()}")
print(f"Number of timepoints in seg0= {recording.get_num_frames(segment_index=0)}")
print(f"Number of timepoints in seg1= {recording.get_num_frames(segment_index=1)}")
Number of channels = 7
Sampling frequency = 30000.0 Hz
Number of segments= 2
Number of timepoints in seg0= 300000
Number of timepoints in seg1= 450000
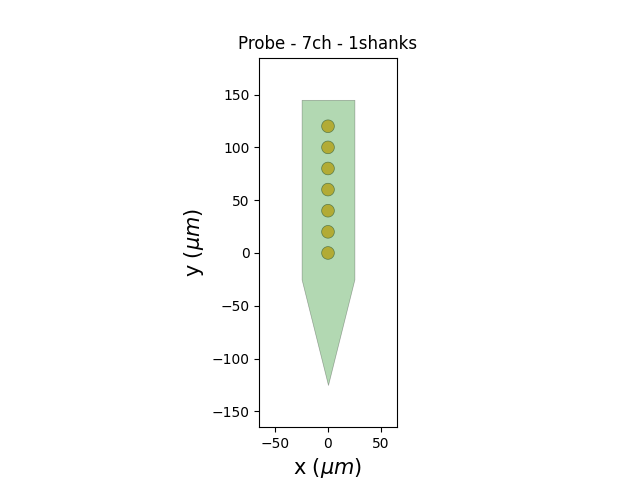
The geometry of the Probe is handled with the ProbeInterface library. Let’s generate a linear probe by specifying our number of electrodes/contacts (num_elec) the distance between the contacts (ypitch), their shape (contact_shapes) and their size (contact_shape_params):
from probeinterface import generate_linear_probe
from probeinterface.plotting import plot_probe

probe = generate_linear_probe(num_elec=7, ypitch=20, contact_shapes="circle", contact_shape_params={"radius": 6})

# the probe has to be wired to the recording device (i.e., which electrode corresponds to an entry in the data
# matrix)
probe.set_device_channel_indices(np.arange(7))

# then we need to actually set the probe to the recording object
recording = recording.set_probe(probe)
plot_probe(probe)
(<matplotlib.collections.PolyCollection object at 0x7fde7d8420b0>, <matplotlib.collections.PolyCollection object at 0x7fde7d68bb50>)
Some extractors also implement a write function.
file_paths = ["traces0.raw", "traces1.raw"]
se.BinaryRecordingExtractor.write_recording(recording, file_paths)
write_binary_recording:   0%|          | 0/25 [00:00<?, ?it/s]
write_binary_recording:  48%|####8     | 12/25 [00:00<00:00, 113.95it/s]
write_binary_recording:  96%|#########6| 24/25 [00:00<00:00, 115.13it/s]
write_binary_recording: 100%|##########| 25/25 [00:00<00:00, 114.66it/s]
We can read the written recording back with the proper extractor. Note that this new recording is now “on disk” and not “in memory” as the Numpy recording was. This means that the loading is “lazy” and the data are not loaded into memory.
recording2 = se.BinaryRecordingExtractor(
    file_paths=file_paths, sampling_frequency=sampling_frequency, num_channels=num_channels, dtype=traces0.dtype
)
print(recording2)
BinaryRecordingExtractor: 7 channels - 30.0kHz - 2 segments - 750,000 samples - 25.00s
                          float64 dtype - 40.05 MiB
Segments:
Samples:   300,000 | 450,000
Durations: 10.00s | 15.00s
Memory:    16.02 MiB | 24.03 MiB
  file_paths: ['/home/docs/checkouts/readthedocs.org/user_builds/spikeinterface/checkouts/latest/examples/modules_gallery/core/traces0.raw', '/home/docs/checkouts/readthedocs.org/user_builds/spikeinterface/checkouts/latest/examples/modules_gallery/core/traces1.raw']
Loading traces in memory is done on demand:
# entire segment 0
traces0 = recording2.get_traces(segment_index=0)
# part of segment 1
traces1_short = recording2.get_traces(segment_index=1, end_frame=50)
print(traces0.shape)
print(traces1_short.shape)
(300000, 7)
(50, 7)
Internally, a recording has channel_ids: that are a vector that can have a
dtype of int or str:
print("chan_ids (dtype=int):", recording.get_channel_ids())

recording3 = se.NumpyRecording(
    traces_list=[traces0, traces1],
    sampling_frequency=sampling_frequency,
    channel_ids=["a", "b", "c", "d", "e", "f", "g"],
)
print("chan_ids (dtype=str):", recording3.get_channel_ids())
chan_ids (dtype=int): [0 1 2 3 4 5 6]
chan_ids (dtype=str): ['a' 'b' 'c' 'd' 'e' 'f' 'g']
channel_ids are used to retrieve information (e.g. traces) only on a
subset of channels:
traces = recording3.get_traces(segment_index=1, end_frame=50, channel_ids=["a", "d"])
print(traces.shape)
(50, 2)
You can also get a recording with a subset of channels (i.e. a channel slice):
recording4 = recording3.channel_slice(channel_ids=["a", "c", "e"])
print(recording4)
print(recording4.get_channel_ids())

# which is equivalent to
from spikeinterface import ChannelSliceRecording

recording4 = ChannelSliceRecording(recording3, channel_ids=["a", "c", "e"])
ChannelSliceRecording: 3 channels - 30.0kHz - 2 segments - 750,000 samples - 25.00s
                       float64 dtype - 17.17 MiB
Segments:
Samples:   300,000 | 450,000
Durations: 10.00s | 15.00s
Memory:    6.87 MiB | 10.30 MiB
['a' 'c' 'e']
Another possibility is to split a recording based on a certain property (e.g. ‘group’)
recording3.set_property("group", [0, 0, 0, 1, 1, 1, 2])

recordings = recording3.split_by(property="group")
print(recordings)
print(recordings[0].get_channel_ids())
print(recordings[1].get_channel_ids())
print(recordings[2].get_channel_ids())
{0: ChannelSliceRecording: 3 channels - 30.0kHz - 2 segments - 750,000 samples - 25.00s
                       float64 dtype - 17.17 MiB
Segments:
Samples:   300,000 | 450,000
Durations: 10.00s | 15.00s
Memory:    6.87 MiB | 10.30 MiB, 1: ChannelSliceRecording: 3 channels - 30.0kHz - 2 segments - 750,000 samples - 25.00s
                       float64 dtype - 17.17 MiB
Segments:
Samples:   300,000 | 450,000
Durations: 10.00s | 15.00s
Memory:    6.87 MiB | 10.30 MiB, 2: ChannelSliceRecording: 1 channels - 30.0kHz - 2 segments - 750,000 samples - 25.00s
                       float64 dtype - 5.72 MiB
Segments:
Samples:   300,000 | 450,000
Durations: 10.00s | 15.00s
Memory:    2.29 MiB | 3.43 MiB}
['a' 'b' 'c']
['d' 'e' 'f']
['g']
- A recording can be “dumped” (exported) to:
a dict
a json file
a pickle file
The “dump” operation is lazy, i.e., the traces are not exported. Only the information about how to reconstruct the recording are dumped:
from spikeinterface import load_extractor
from pprint import pprint

d = recording2.to_dict()
pprint(d)

recording2_loaded = load_extractor(d)
print(recording2_loaded)
{'annotations': {'is_filtered': False},
 'class': 'spikeinterface.core.binaryrecordingextractor.BinaryRecordingExtractor',
 'kwargs': {'channel_ids': [0, 1, 2, 3, 4, 5, 6],
            'dtype': '<f8',
            'file_offset': 0,
            'file_paths': ['/home/docs/checkouts/readthedocs.org/user_builds/spikeinterface/checkouts/latest/examples/modules_gallery/core/traces0.raw',
                           '/home/docs/checkouts/readthedocs.org/user_builds/spikeinterface/checkouts/latest/examples/modules_gallery/core/traces1.raw'],
            'gain_to_uV': None,
            'is_filtered': None,
            'num_channels': 7,
            'offset_to_uV': None,
            'sampling_frequency': 30000.0,
            't_starts': None,
            'time_axis': 0},
 'module': 'spikeinterface',
 'properties': {'gain_to_uV': None,
                'group': None,
                'location': None,
                'offset_to_uV': None},
 'relative_paths': False,
 'version': '0.101.0'}
BinaryRecordingExtractor: 7 channels - 30.0kHz - 2 segments - 750,000 samples - 25.00s
                          float64 dtype - 40.05 MiB
Segments:
Samples:   300,000 | 450,000
Durations: 10.00s | 15.00s
Memory:    16.02 MiB | 24.03 MiB
  file_paths: ['/home/docs/checkouts/readthedocs.org/user_builds/spikeinterface/checkouts/latest/examples/modules_gallery/core/traces0.raw', '/home/docs/checkouts/readthedocs.org/user_builds/spikeinterface/checkouts/latest/examples/modules_gallery/core/traces1.raw']
The dictionary can also be dumped directly to a JSON file on disk:
recording2.dump("my_recording.json")

recording2_loaded = load_extractor("my_recording.json")
print(recording2_loaded)
BinaryRecordingExtractor: 7 channels - 30.0kHz - 2 segments - 750,000 samples - 25.00s
                          float64 dtype - 40.05 MiB
Segments:
Samples:   300,000 | 450,000
Durations: 10.00s | 15.00s
Memory:    16.02 MiB | 24.03 MiB
  file_paths: ['/home/docs/checkouts/readthedocs.org/user_builds/spikeinterface/checkouts/latest/examples/modules_gallery/core/traces0.raw', '/home/docs/checkouts/readthedocs.org/user_builds/spikeinterface/checkouts/latest/examples/modules_gallery/core/traces1.raw']
IMPORTANT: the “dump” operation DOES NOT copy the traces to disk!
If you wish to also store the traces in a compact way you need to use the
save() function. This operation is very useful to save traces obtained
after long computations (e.g. filtering or referencing):
recording2.save(folder="./my_recording")

import os

pprint(os.listdir("./my_recording"))

recording2_cached = load_extractor("my_recording.json")
print(recording2_cached)
write_binary_recording with n_jobs = 1 and chunk_size = 30000

write_binary_recording:   0%|          | 0/25 [00:00<?, ?it/s]
write_binary_recording:  44%|####4     | 11/25 [00:00<00:00, 109.26it/s]
write_binary_recording:  88%|########8 | 22/25 [00:00<00:00, 103.15it/s]
write_binary_recording: 100%|##########| 25/25 [00:00<00:00, 104.73it/s]
['binary.json',
 'si_folder.json',
 'properties',
 'traces_cached_seg0.raw',
 'traces_cached_seg1.raw',
 'provenance.json']
BinaryRecordingExtractor: 7 channels - 30.0kHz - 2 segments - 750,000 samples - 25.00s
                          float64 dtype - 40.05 MiB
Segments:
Samples:   300,000 | 450,000
Durations: 10.00s | 15.00s
Memory:    16.02 MiB | 24.03 MiB
  file_paths: ['/home/docs/checkouts/readthedocs.org/user_builds/spikeinterface/checkouts/latest/examples/modules_gallery/core/traces0.raw', '/home/docs/checkouts/readthedocs.org/user_builds/spikeinterface/checkouts/latest/examples/modules_gallery/core/traces1.raw']
Total running time of the script: (0 minutes 0.953 seconds)