Note
Click here to download the full example code
Compare spike sorting output with ground-truth recordings
Simulated recordings or paired pipette and extracellular recordings can be used to validate spike sorting algorithms.
For comparing to ground-truth data, the
compare_sorter_to_ground_truth(gt_sorting, tested_sorting) function
can be used. In this recording, we have ground-truth information for all
units, so we can set exhaustive_gt to True.
Import
import numpy as np
import pandas as pd
import matplotlib.pyplot as plt
import seaborn as sns

import spikeinterface.extractors as se
import spikeinterface.sorters as ss
import spikeinterface.comparison as sc
import spikeinterface.widgets as sw
recording, sorting_true = se.example_datasets.toy_example(num_channels=4, duration=10, seed=0)

sorting_MS4 = ss.run_mountainsort4(recording)
Out:
Warning! The recording is already filtered, but Mountainsort4 filter is enabled. You can disable filters by setting 'filter' parameter to False
cmp_gt_MS4 = sc.compare_sorter_to_ground_truth(sorting_true, sorting_MS4, exhaustive_gt=True)
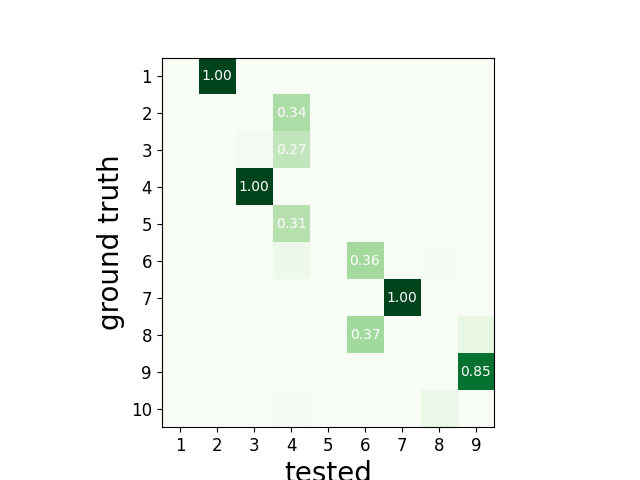
To have an overview of the match we can use the unordered agreement matrix
sw.plot_agreement_matrix(cmp_gt_MS4, ordered=False)
Out:
<spikewidgets.widgets.agreementmatrixwidget.agreementmatrixwidget.AgreementMatrixWidget object at 0x7f3dfc2ef978>
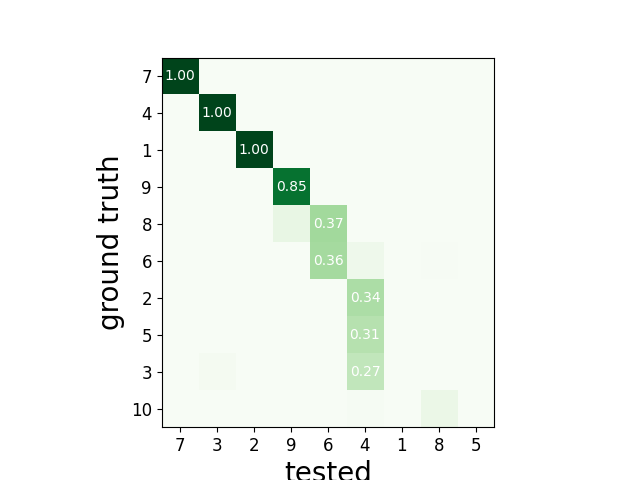
or ordered
sw.plot_agreement_matrix(cmp_gt_MS4, ordered=True)
Out:
<spikewidgets.widgets.agreementmatrixwidget.agreementmatrixwidget.AgreementMatrixWidget object at 0x7f3dfc73f0b8>
This function first matches the ground-truth and spike sorted units, and then it computes several performance metrics.
Once the spike trains are matched, each spike is labelled as:
- true positive (tp): spike found both in
gt_sortingandtested_sorting - false negative (fn): spike found in
gt_sorting, but not intested_sorting - false positive (fp): spike found in
tested_sorting, but not ingt_sorting
From the counts of these labels the following performance measures are computed:
- accuracy: #tp / (#tp+ #fn + #fp)
- recall: #tp / (#tp + #fn)
- precision: #tp / (#tp + #fn)
- miss rate: #fn / (#tp + #fn1)
- false discovery rate: #fp / (#tp + #fp)
The get_performance method a pandas dataframe (or a dictionary if
output='dict') with the comparison metrics. By default, these are
calculated for each spike train of sorting1:code:, the results can be
pooles by average (average of the metrics) and by sum (all counts are
summed and the metrics are computed then).
perf = cmp_gt_MS4.get_performance()
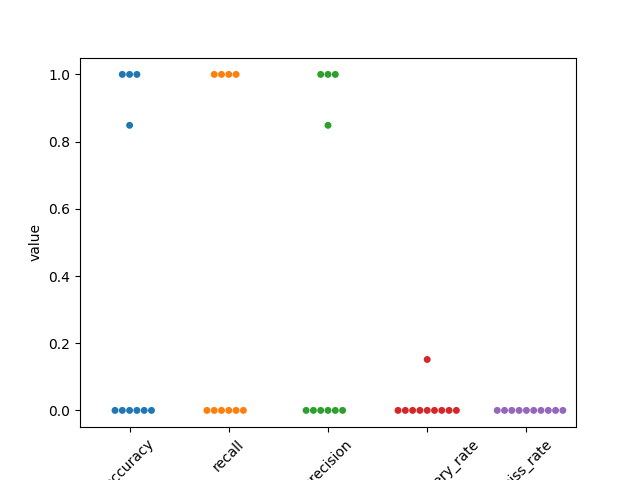
Lets use seaborn swarm plot
fig1, ax1 = plt.subplots()
perf2 = pd.melt(perf, var_name='measurement')
ax1 = sns.swarmplot(data=perf2, x='measurement', y='value', ax=ax1)
ax1.set_xticklabels(labels=ax1.get_xticklabels(), rotation=45)
Out:
[Text(0, 0, 'accuracy'), Text(1, 0, 'recall'), Text(2, 0, 'precision'), Text(3, 0, 'false_discovery_rate'), Text(4, 0, 'miss_rate')]
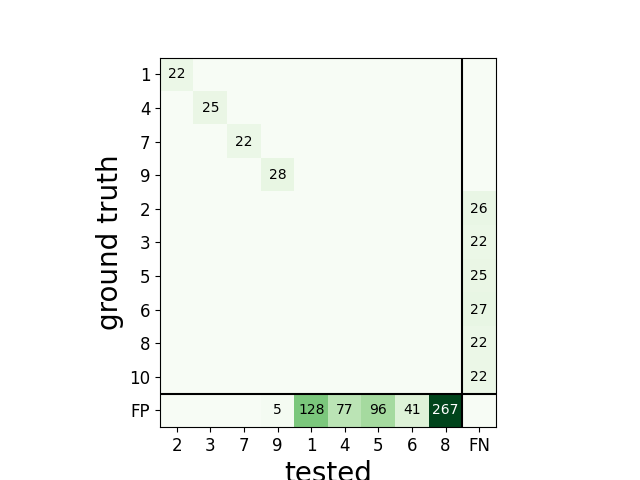
The confusion matrix is also a good summary of the score as it has the same shape as agreement matrix, but it contains an extra column for FN
and an extra row for FP
sw.plot_confusion_matrix(cmp_gt_MS4)
Out:
<spikewidgets.widgets.confusionmatrixwidget.confusionmatrixwidget.ConfusionMatrixWidget object at 0x7f3e056777b8>
We can query the well and bad detected units. By default, the threshold on accuracy is 0.95.
cmp_gt_MS4.get_well_detected_units()
Out:
[2, 3, 7, 9]
cmp_gt_MS4.get_false_positive_units()
Out:
[1, 5, 8]
cmp_gt_MS4.get_redundant_units()
Out:
[]
Lets do the same for klusta
sorting_KL = ss.run_klusta(recording)
cmp_gt_KL = sc.compare_sorter_to_ground_truth(sorting_true, sorting_KL, exhaustive_gt=True)
Out:
RUNNING SHELL SCRIPT: /home/docs/checkouts/readthedocs.org/user_builds/spikeinterface/checkouts/0.13.0/examples/modules/comparison/klusta_output/run_klusta.sh
/home/docs/checkouts/readthedocs.org/user_builds/spikeinterface/checkouts/0.13.0/doc/sources/spikesorters/spikesorters/basesorter.py:158: ResourceWarning: unclosed file <_io.TextIOWrapper name=63 encoding='UTF-8'>
  self._run(recording, self.output_folders[i])
perf = cmp_gt_KL.get_performance()

print(perf)
Out:
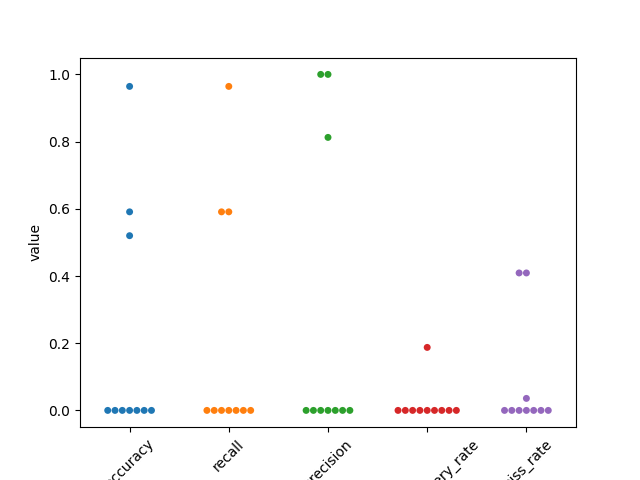
            accuracy    recall precision false_discovery_rate  miss_rate
gt_unit_id
1                  0         0         0                    0          0
2                  0         0         0                    0          0
3               0.52  0.590909    0.8125               0.1875   0.409091
4                  0         0         0                    0          0
5                  0         0         0                    0          0
6                  0         0         0                    0          0
7                  0         0         0                    0          0
8           0.590909  0.590909         1                    0   0.409091
9           0.964286  0.964286         1                    0  0.0357143
10                 0         0         0                    0          0
Lets use seaborn swarm plot
fig2, ax2 = plt.subplots()
perf2 = pd.melt(perf, var_name='measurement')
ax2 = sns.swarmplot(data=perf2, x='measurement', y='value', ax=ax2)
ax2.set_xticklabels(labels=ax2.get_xticklabels(), rotation=45)
Out:
[Text(0, 0, 'accuracy'), Text(1, 0, 'recall'), Text(2, 0, 'precision'), Text(3, 0, 'false_discovery_rate'), Text(4, 0, 'miss_rate')]
print(cmp_gt_KL.get_well_detected_units)
Out:
<bound method GroundTruthComparison.get_well_detected_units of <spikecomparison.groundtruthcomparison.GroundTruthComparison object at 0x7f3dfc861cc0>>
print(cmp_gt_KL.get_false_positive_units())
Out:
[6]
print(cmp_gt_KL.get_redundant_units())
Out:
[]
Total running time of the script: ( 0 minutes 4.533 seconds)