Note
Click here to download the full example code
Waveforms Widgets Gallery
Here is a gallery of all the available widgets using a pair of RecordingExtractor-SortingExtractor objects.
import matplotlib.pyplot as plt

import spikeinterface as si
import spikeinterface.extractors as se
import spikeinterface.widgets as sw
- First, let’s download a simulated dataset
from the repo ‘https://gin.g-node.org/NeuralEnsemble/ephy_testing_data’
local_path = si.download_dataset(remote_path='mearec/mearec_test_10s.h5')
recording = se.MEArecRecordingExtractor(local_path)
sorting = se.MEArecSortingExtractor(local_path)
print(recording)
print(sorting)
Out:
/home/docs/checkouts/readthedocs.org/user_builds/spikeinterface/conda/0.93.0/lib/python3.8/site-packages/MEArec/tools.py:339: DeprecationWarning: distutils Version classes are deprecated. Use packaging.version instead.
  if StrictVersion(mearec_version) >= '1.5.0':
/home/docs/checkouts/readthedocs.org/user_builds/spikeinterface/conda/0.93.0/lib/python3.8/site-packages/MEArec/tools.py:339: DeprecationWarning: distutils Version classes are deprecated. Use packaging.version instead.
  if StrictVersion(mearec_version) >= '1.5.0':
MEArecRecordingExtractor: 32 channels - 1 segments - 32.0kHz - 10.000s
  file_path: /home/docs/spikeinterface_datasets/ephy_testing_data/mearec/mearec_test_10s.h5
MEArecSortingExtractor: 10 units - 1 segments - 32.0kHz
  file_path: /home/docs/spikeinterface_datasets/ephy_testing_data/mearec/mearec_test_10s.h5
Extract spike waveforms
For convenience, metrics are computed on the WaveformExtractor object that gather recording/sorting and extracted waveforms in a single object
folder = 'waveforms_mearec'
we = si.extract_waveforms(recording, sorting, folder,
    load_if_exists=True,
    ms_before=1, ms_after=2., max_spikes_per_unit=500,
    n_jobs=1, chunk_size=30000)
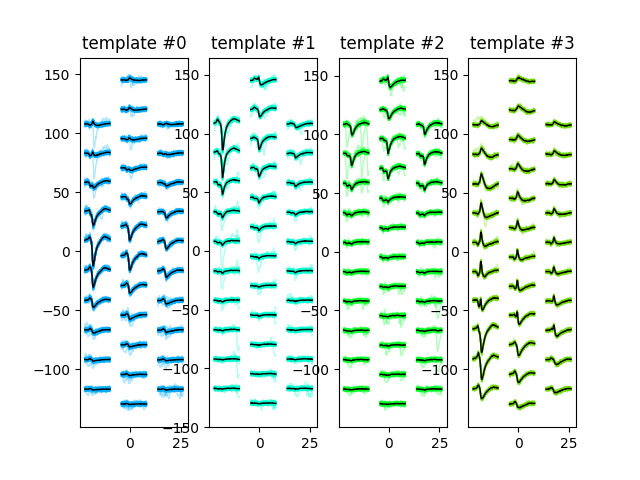
plot_unit_waveforms()
unit_ids = sorting.unit_ids[:4]

sw.plot_unit_waveforms(we, unit_ids=unit_ids)
Out:
<spikeinterface.widgets.unitwaveforms.UnitWaveformsWidget object at 0x7fee9986d850>
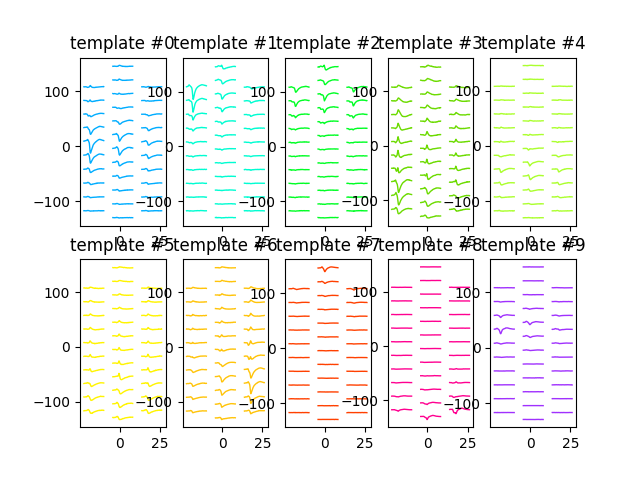
plot_unit_templates()
unit_ids = sorting.unit_ids

sw.plot_unit_templates(we, unit_ids=unit_ids, ncols=5)
Out:
<spikeinterface.widgets.unitwaveforms.UnitWaveformsWidget object at 0x7feea323d280>
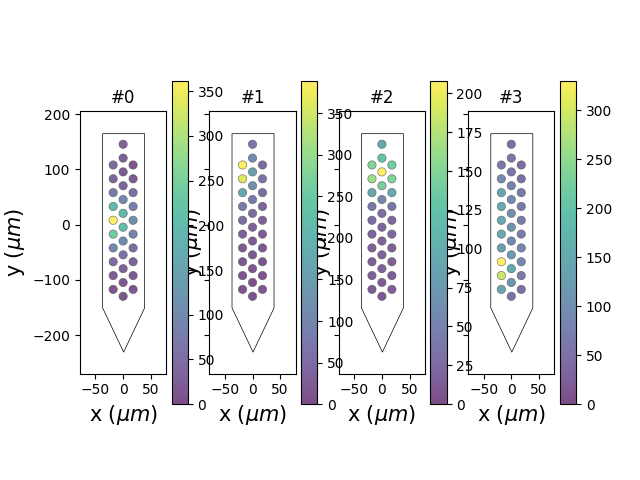
plot_unit_probe_map()
unit_ids = sorting.unit_ids[:4]
sw.plot_unit_probe_map(we, unit_ids=unit_ids)
Out:
<spikeinterface.widgets.unitprobemap.UnitProbeMapWidget object at 0x7fee999d4d00>
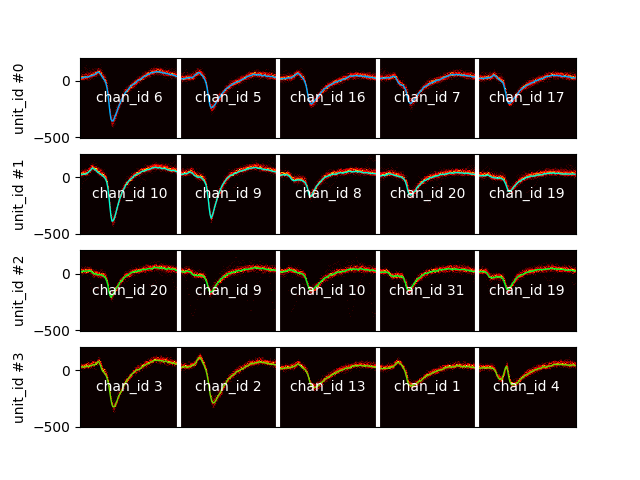
plot_unit_waveform_density_map()
This is your best friend to check over merge
unit_ids = sorting.unit_ids[:4]
sw.plot_unit_waveform_density_map(we, unit_ids=unit_ids, max_channels=5)
Out:
<spikeinterface.widgets.unitwaveformdensitymap.UnitWaveformDensityMapWidget object at 0x7fee999f4880>
plot_amplitudes_distribution()
sw.plot_amplitudes_distribution(we)
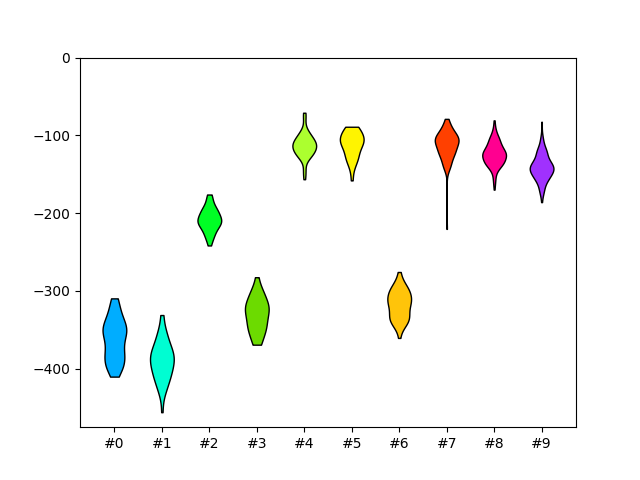
Out:
<spikeinterface.widgets.amplitudes.AmplitudeDistributionWidget object at 0x7fee999f00a0>
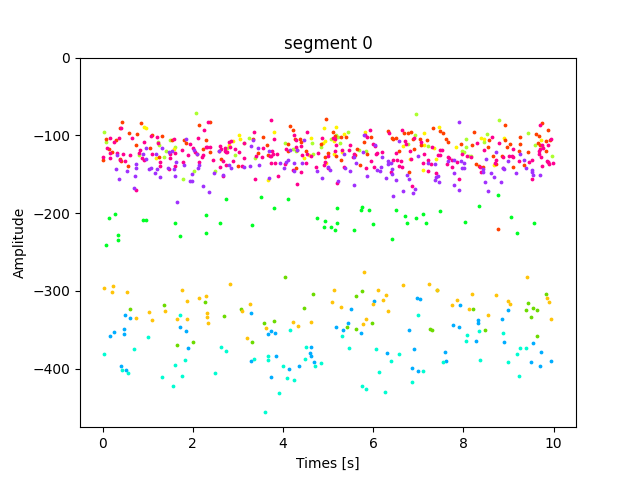
plot_amplitudes_timeseres()
sw.plot_amplitudes_timeseries(we)
Out:
/home/docs/checkouts/readthedocs.org/user_builds/spikeinterface/conda/0.93.0/lib/python3.8/site-packages/MEArec/tools.py:339: DeprecationWarning: distutils Version classes are deprecated. Use packaging.version instead.
  if StrictVersion(mearec_version) >= '1.5.0':
/home/docs/checkouts/readthedocs.org/user_builds/spikeinterface/conda/0.93.0/lib/python3.8/site-packages/MEArec/tools.py:339: DeprecationWarning: distutils Version classes are deprecated. Use packaging.version instead.
  if StrictVersion(mearec_version) >= '1.5.0':

<spikeinterface.widgets.amplitudes.AmplitudeTimeseriesWidget object at 0x7fee9a844ee0>
plot_units_depth_vs_amplitude()
sw.plot_units_depth_vs_amplitude(we)
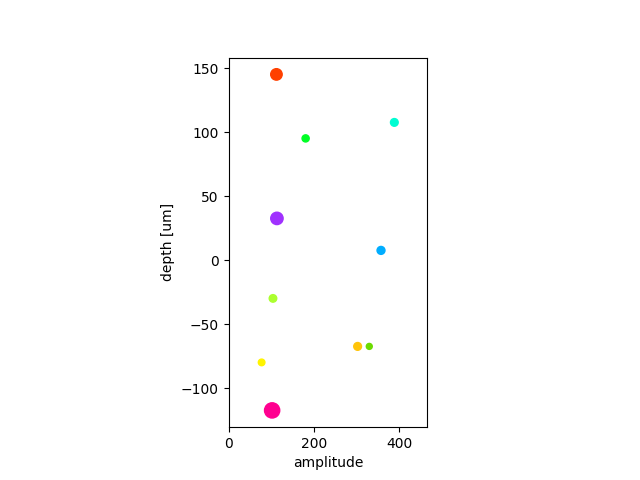
Out:
<spikeinterface.widgets.depthamplitude.UnitsDepthAmplitudeWidget object at 0x7fee9a8b7370>
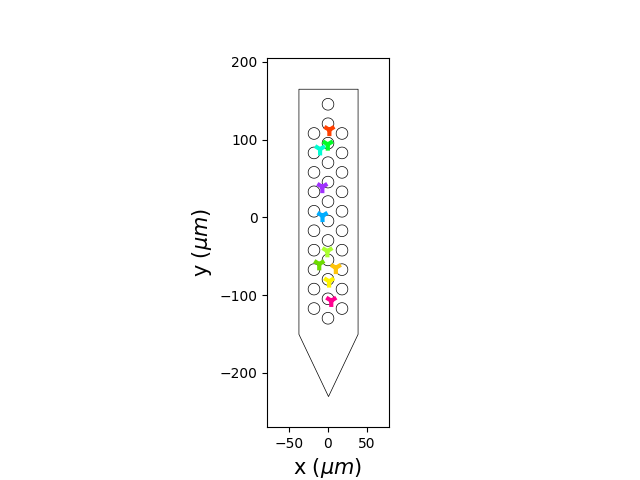
plot_unit_localization()
sw.plot_unit_localization(we, method='center_of_mass')


plt.show()
Total running time of the script: ( 0 minutes 2.681 seconds)