Note
Go to the end to download the full example code
Waveforms Widgets Gallery
Here is a gallery of all the available widgets using a pair of RecordingExtractor-SortingExtractor objects.
import matplotlib.pyplot as plt

import spikeinterface as si
import spikeinterface.extractors as se
import spikeinterface.postprocessing as spost
import spikeinterface.widgets as sw
- First, let’s download a simulated dataset
from the repo ‘https://gin.g-node.org/NeuralEnsemble/ephy_testing_data’
local_path = si.download_dataset(remote_path='mearec/mearec_test_10s.h5')
recording = se.MEArecRecordingExtractor(local_path)
sorting = se.MEArecSortingExtractor(local_path)
print(recording)
print(sorting)
MEArecRecordingExtractor: 32 channels - 1 segments - 32.0kHz - 10.000s
  file_path: /home/docs/spikeinterface_datasets/ephy_testing_data/mearec/mearec_test_10s.h5
MEArecSortingExtractor: 10 units - 1 segments - 32.0kHz
  file_path: /home/docs/spikeinterface_datasets/ephy_testing_data/mearec/mearec_test_10s.h5
Extract spike waveforms
For convenience, metrics are computed on the WaveformExtractor object that gather recording/sorting and extracted waveforms in a single object
folder = 'waveforms_mearec'
we = si.extract_waveforms(recording, sorting, folder,
    load_if_exists=True,
    ms_before=1, ms_after=2., max_spikes_per_unit=500,
    n_jobs=1, chunk_size=30000)

# pre-compute postprocessing data
_ = spost.compute_spike_amplitudes(we)
_ = spost.compute_unit_locations(we)
_ = spost.compute_spike_locations(we)
_ = spost.compute_template_metrics(we)
/home/docs/checkouts/readthedocs.org/user_builds/spikeinterface/checkouts/0.97.1/examples/modules_gallery/widgets/plot_3_waveforms_gallery.py:32: DeprecationWarning: load_if_exists=True/false is deprcated. Use load_waveforms() instead.
  we = si.extract_waveforms(recording, sorting, folder,

extract waveforms memmap:   0%|          | 0/11 [00:00<?, ?it/s]
extract waveforms memmap:  82%|########1 | 9/11 [00:00<00:00, 87.97it/s]
extract waveforms memmap: 100%|##########| 11/11 [00:00<00:00, 89.27it/s]

extract amplitudes:   0%|          | 0/10 [00:00<?, ?it/s]
extract amplitudes: 100%|##########| 10/10 [00:00<00:00, 265.94it/s]

localize peaks:   0%|          | 0/10 [00:00<?, ?it/s]
localize peaks: 100%|##########| 10/10 [00:00<00:00, 327.28it/s]
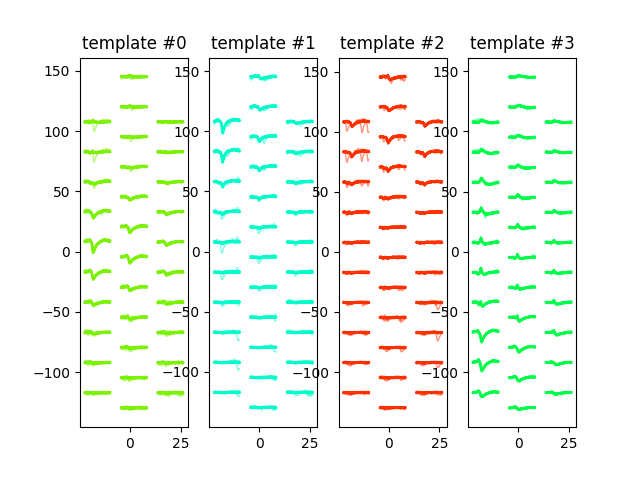
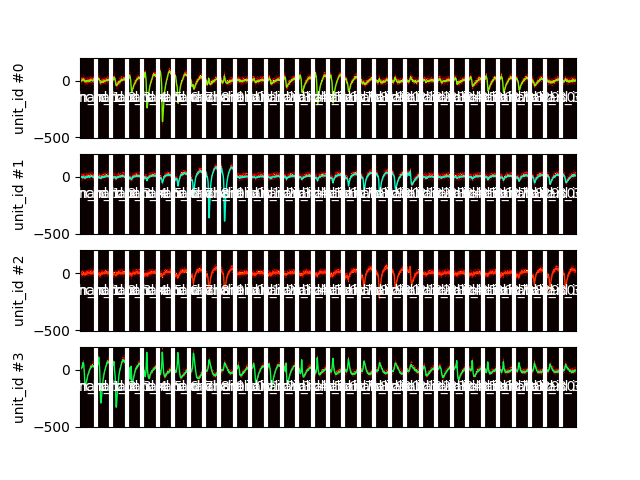
plot_unit_waveforms()
unit_ids = sorting.unit_ids[:4]

sw.plot_unit_waveforms(we, unit_ids=unit_ids)
<spikeinterface.widgets.matplotlib.unit_waveforms.UnitWaveformPlotter object at 0x7f6ae310ab50>
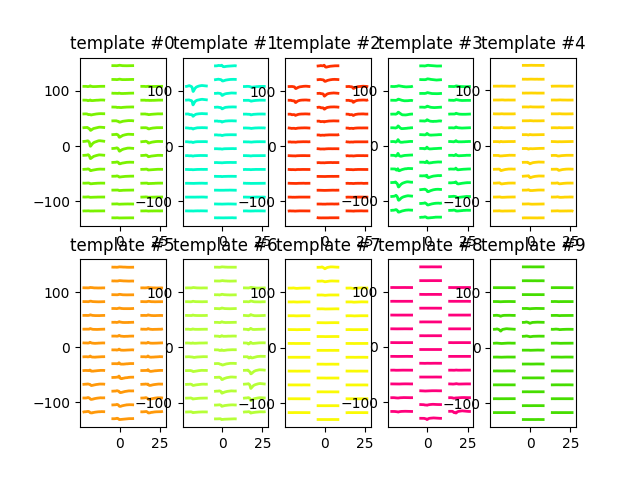
plot_unit_templates()
unit_ids = sorting.unit_ids

sw.plot_unit_templates(we, unit_ids=unit_ids, ncols=5)
<spikeinterface.widgets.matplotlib.unit_templates.UnitTemplatesPlotter object at 0x7f6ae64e7af0>
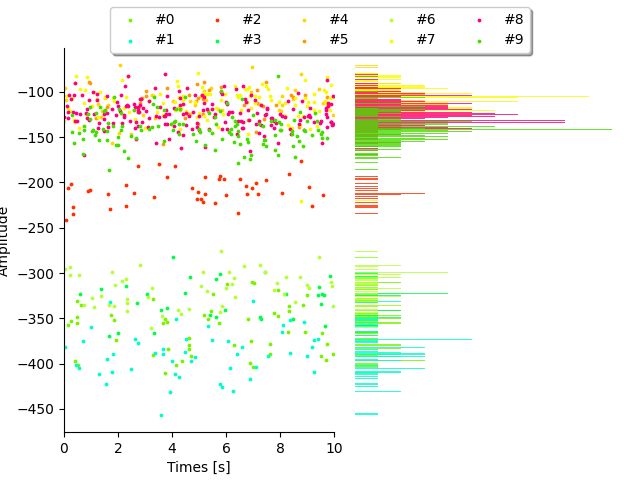
plot_amplitudes()
sw.plot_amplitudes(we, plot_histograms=True)
<spikeinterface.widgets.matplotlib.amplitudes.AmplitudesPlotter object at 0x7f6ae64e7a90>
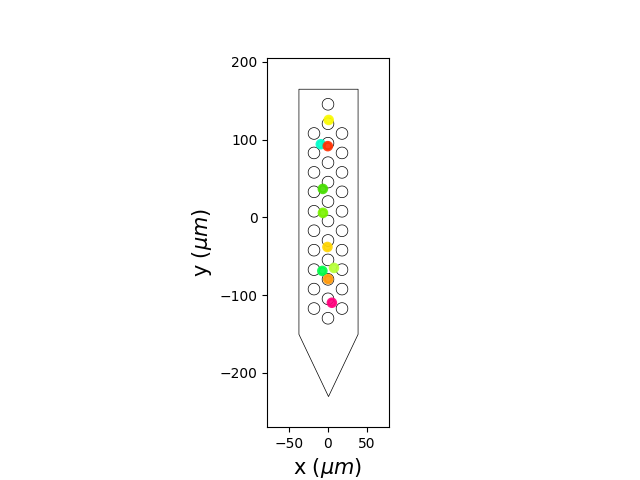
plot_unit_locations()
sw.plot_unit_locations(we)
<spikeinterface.widgets.matplotlib.unit_locations.UnitLocationsPlotter object at 0x7f6ae3308c10>
plot_unit_waveform_density_map()
This is your best friend to check over merge
unit_ids = sorting.unit_ids[:4]
sw.plot_unit_waveforms_density_map(we, unit_ids=unit_ids)
<spikeinterface.widgets.matplotlib.unit_waveforms_density_map.UnitWaveformDensityMapPlotter object at 0x7f6ad9f7e9a0>
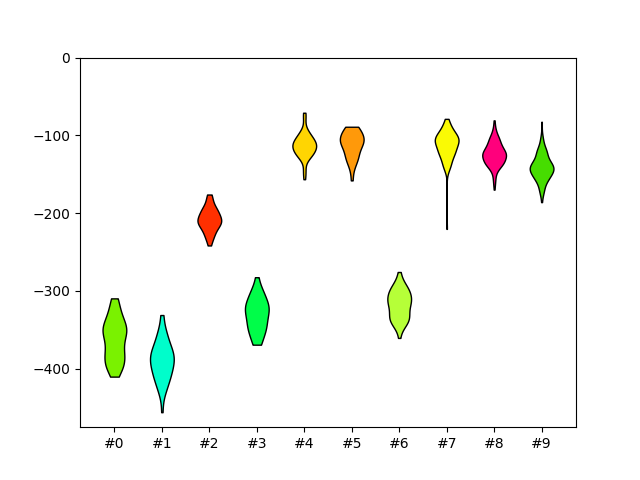
plot_amplitudes_distribution()
sw.plot_all_amplitudes_distributions(we)
<spikeinterface.widgets.matplotlib.all_amplitudes_distributions.AllAmplitudesDistributionsPlotter object at 0x7f6ae63a26a0>
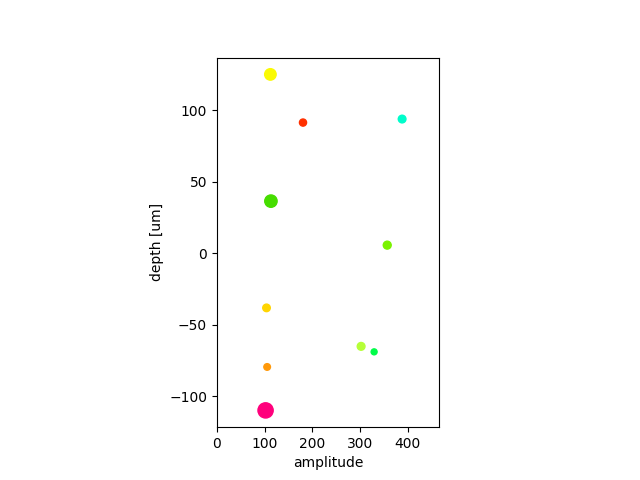
plot_units_depths()
sw.plot_unit_depths(we)
<spikeinterface.widgets.matplotlib.unit_depths.UnitDepthsPlotter object at 0x7f6ae68c10d0>
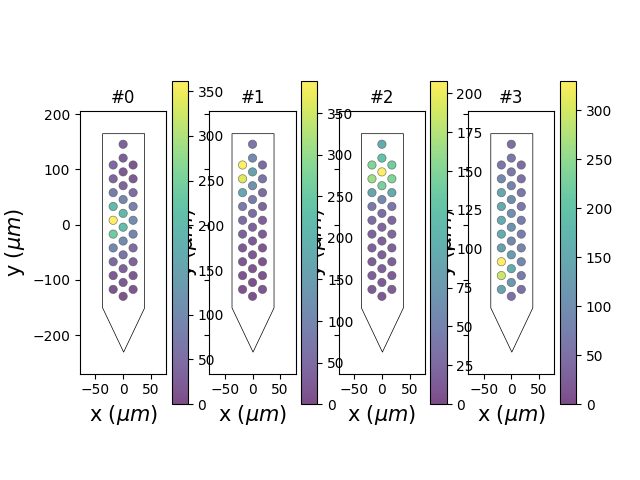
plot_unit_probe_map()
unit_ids = sorting.unit_ids[:4]
sw.plot_unit_probe_map(we, unit_ids=unit_ids)


plt.show()
Total running time of the script: ( 0 minutes 6.605 seconds)