Note
Click here to download the full example code
Waveform Extractor
spikeinterface provides an efficient mechanism to extract waveform snippets.
The WaveformExtractor class:
randomly samples a subset spikes with max_spikes_per_unit
extracts all waveforms snippets for each unit
saves waveforms in a local folder
can load stored waforms
retrieves template (average or median waveform) for each unit
Here the how!
import matplotlib.pyplot as plt
import numpy as np

from spikeinterface import download_dataset
from spikeinterface import WaveformExtractor, extract_waveforms
import spikeinterface.extractors as se
First let’s use the repo https://gin.g-node.org/NeuralEnsemble/ephy_testing_data to download a MEArec dataset. It is a simulated dataset that contains “ground truth” sorting information:
repo = 'https://gin.g-node.org/NeuralEnsemble/ephy_testing_data'
remote_path = 'mearec/mearec_test_10s.h5'
local_path = download_dataset(repo=repo, remote_path=remote_path, local_folder=None)
Let’s now instantiate the recording and sorting objects:
recording = se.MEArecRecordingExtractor(local_path)
print(recording)
sorting = se.MEArecSortingExtractor(local_path)
print(recording)
Out:
MEArecRecordingExtractor: 32 channels - 1 segments - 32.0kHz - 10.000s
  file_path: /home/docs/spikeinterface_datasets/ephy_testing_data/mearec/mearec_test_10s.h5
MEArecRecordingExtractor: 32 channels - 1 segments - 32.0kHz - 10.000s
  file_path: /home/docs/spikeinterface_datasets/ephy_testing_data/mearec/mearec_test_10s.h5
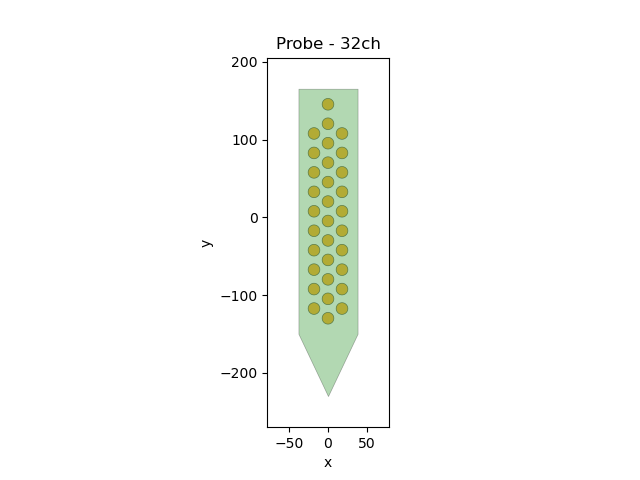
The MEArec dataset already contains a probe object that you can retreive an plot:
probe = recording.get_probe()
print(probe)
from probeinterface.plotting import plot_probe

plot_probe(probe)
Out:
Probe - 32ch

(<matplotlib.collections.PolyCollection object at 0x7f703ce08cd0>, <matplotlib.collections.PolyCollection object at 0x7f703e4593d0>)
A WaveformExtractor object can be created with the extract_waveforms
function:
folder = 'waveform_folder'
we = extract_waveforms(recording, sorting, folder,
                       ms_before=1.5, ms_after=2., max_spikes_per_unit=500,
                       load_if_exists=True)
print(we)
Out:
WaveformExtractor: 32 channels - 10 units - 1 segments
  before:48 after64 n_per_units: 500
Alternativelt, the WaveformExtractor object can be instantiated
directly. In this case, we need to set_params() to set the desired
parameters:
folder = 'waveform_folder2'
we = WaveformExtractor.create(recording, sorting, folder, remove_if_exists=True)
we.set_params(ms_before=3., ms_after=4., max_spikes_per_unit=1000)
we.run(n_jobs=1, chunk_size=30000, progress_bar=True)
print(we)
Out:
extract waveforms:   0%|          | 0/11 [00:00<?, ?it/s]
extract waveforms: 100%|##########| 11/11 [00:00<00:00, 170.79it/s]
WaveformExtractor: 32 channels - 10 units - 1 segments
  before:96 after128 n_per_units: 1000
- The
'waveform_folder'folder contains: the dumped recording (json)
the dumped sorting (json)
the parameters (json)
a subfolder with “waveforms_XXX.npy” and “sampled_index_XXX.npy”
import os

print(os.listdir(folder))
print(os.listdir(folder + '/waveforms'))
Out:
['waveforms', 'sorting.json', 'recording.json', 'params.json']
['waveforms_#1.npy', 'sampled_index_#4.npy', 'sampled_index_#1.npy', 'waveforms_#8.npy', 'sampled_index_#7.npy', 'sampled_index_#5.npy', 'waveforms_#7.npy', 'waveforms_#5.npy', 'waveforms_#4.npy', 'waveforms_#9.npy', 'sampled_index_#0.npy', 'sampled_index_#9.npy', 'sampled_index_#8.npy', 'sampled_index_#6.npy', 'waveforms_#0.npy', 'sampled_index_#3.npy', 'sampled_index_#2.npy', 'waveforms_#3.npy', 'waveforms_#6.npy', 'waveforms_#2.npy']
Now we can retrieve waveforms per unit on-the-fly. The waveforms shape is (num_spikes, num_sample, num_channel):
unit_ids = sorting.unit_ids

for unit_id in unit_ids:
    wfs = we.get_waveforms(unit_id)
    print(unit_id, ':', wfs.shape)
Out:
#0 : (53, 224, 32)
#1 : (50, 224, 32)
#2 : (43, 224, 32)
#3 : (30, 224, 32)
#4 : (48, 224, 32)
#5 : (37, 224, 32)
#6 : (51, 224, 32)
#7 : (110, 224, 32)
#8 : (194, 224, 32)
#9 : (129, 224, 32)
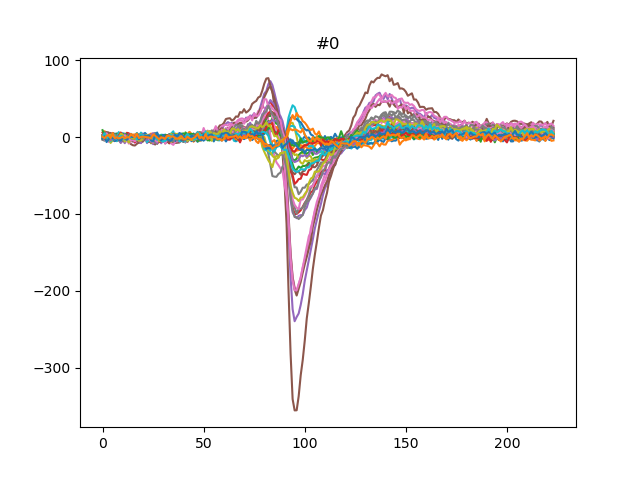
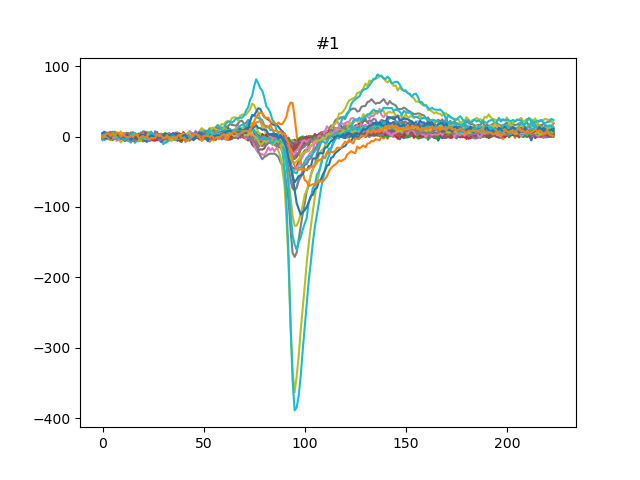
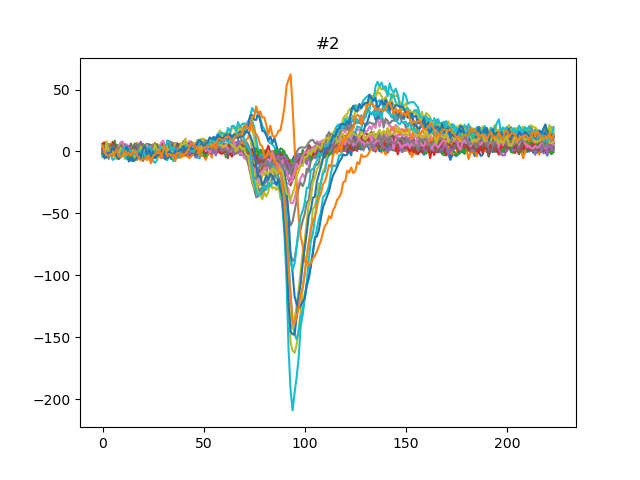
We can also get the template for each units either using the median or the average:
for unit_id in unit_ids[:3]:
    fig, ax = plt.subplots()
    template = we.get_template(unit_id=unit_id, mode='median')
    print(template.shape)
    ax.plot(template)
    ax.set_title(f'{unit_id}')

plt.show()
Out:
(224, 32)
(224, 32)
(224, 32)
Total running time of the script: ( 0 minutes 0.937 seconds)